TRUCKEE, Calif., Dec. 2, 2013 (GLOBE NEWSWIRE) -- Clear Capital®, the premium provider of data and solutions for real estate asset valuation and collateral risk assessment, today released its Home Data Index™ (HDI) Market Report with data through November 2013. Using a broad array of public and proprietary data sources, the HDI Market Report publishes the most granular home data and analysis earlier than nearly any other index provider in the industry.
November 2013 highlights include:
-- National and regional rates of growth showed clear signs of moderation in November, as summer buying activity gave way to the typical winter slow down.
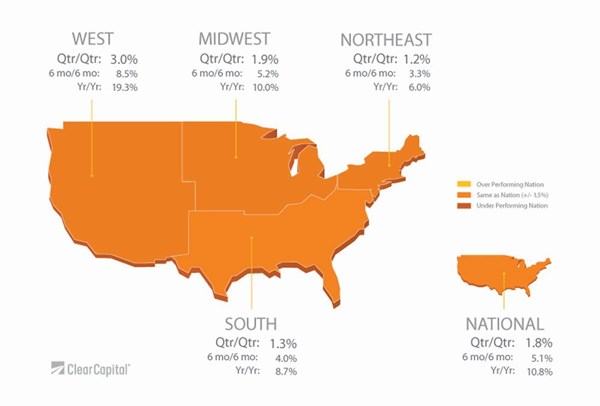
- Nationally, home prices pulled back to 10.8% year-over-year growth, a slight tapering over the previous quarter's 11.0% yearly growth.
- More notable moderation took place in quarterly growth. November national quarterly growth of 1.8% was nearly cut in half when compared to the previous quarter's 3.3% growth.
- The regions experienced moderation over yearly and quarterly rates of growth as well, with few exceptions. The Midwest and the Northeast were the only regions to see slight gains in yearly rates of growth over the previous quarter.
-- While REOs and short sales accounted for 21.6% of all national sales over the previous quarter, it is substantially lower than peak rates of 41.0% in 2011.
- Distressed sale activity, as a portion of total sales, can increase over winter due to some fair market sellers waiting for the more active spring season to list their homes.
- Prior to the recovery taking hold, increasing distressed sale saturation rates pushed prices down. Yet, the First-In-First-Out recovery saw distressed markets drive gains, creating a new relationship between high levels of distressed sale saturation and price gains.
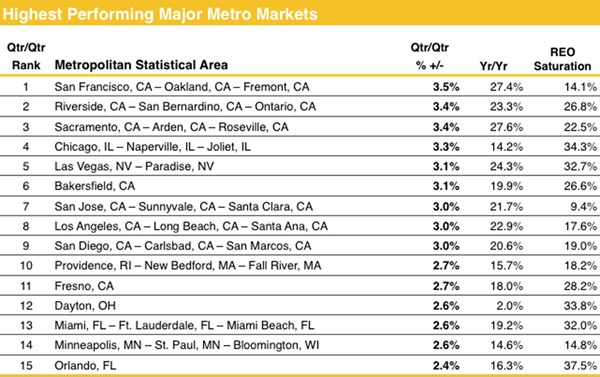
-- The Phoenix MSA has embodied this behavior as one of the first markets to exhibit a sustained recovery alongside its high levels of distressed sale saturation. After significant gains, the market's growth is now moderating with quarterly growth of 2.4%, less than half of the current annual rate of growth when annualized. Having led the recovery for the better part of a year, Phoenix no longer sits on the top 15 performing list. Other metro markets also confirm higher levels of distressed sale activity can now correlate with higher price gains.
- Average rates of yearly growth in the top performing markets were 19.2% in November, while average distressed sale saturation sat at a relatively high 24.5%.
- Low performing markets, on the other hand, had average rates of yearly growth of 4.9% in November, while average distressed sale saturation sat at a relatively low 17.2%.
-- Contact Alanna Harter for your November 2013 file of 30 Major MSAs, or access our data on the Bloomberg Professional service by typing CLCA < GO >.
"As the year comes to a close, make no mistake, home prices across the country are cooling from the red-hot 2013 recovery," said Dr. Alex Villacorta, vice president of research and analytics at Clear Capital. "Though some market observers may take this as a sign of a deflating bubble, we see this as a natural, and welcomed evolution on the horizon of the new housing landscape. Since the market trough in the fall of 2011, national prices are up 17%, undoubtedly a strong resurgence in overall prices. Yet national prices today are back to where they were in 2003, indicating that overall the housing market is at pre-run-up norms.
Understandably, many current homeowners would like to see hot gains continue for some time to come. Market participants, however, are better served by a cooler and more sustainable recovery. Moderating gains will create a stable market, instilling confidence in a broader base of buyers. And as we know all too well, meteoric rises and subsequent falls in prices create increasing risk of all types. That's not to say all markets will continue a slow and steady assent. Next month, we release our 2014 forecasts and expect to see some interesting trends at the metro market level. Interestingly, for some metros, future declines are not out of the question."
For the complete file of the 30 Major MSA price trends for November 2013, please contact Alanna Harter.
Photos accompanying this release are available at
http://www.globenewswire.com/newsroom/prs/?pkgid=22467
http://www.globenewswire.com/newsroom/prs/?pkgid=22468
http://www.globenewswire.com/newsroom/prs/?pkgid=22469


