TRUCKEE, Calif., June 4, 2013 (GLOBE NEWSWIRE) -- Clear Capital®, the premium provider of data and solutions for real estate asset valuation and collateral risk assessment, today released its Home Data Index™ (HDI) Market Report with data through May 2013. Using a broad array of public and proprietary data sources, the HDI Market Report publishes the most granular home data and analysis earlier than nearly any other index provider in the industry.
May 2013 highlights include:
- Spring buying activity started to take marginal effect on short-term price trends as quarterly, national and regional gains saw a slight uptick over April. The West, South, Northeast and Midwest saw quarterly gains of 2.4%, 1.1%, 0.8% and 0.7%, respectively.
- Nationally, home prices saw a 1.3% quarterly gain, while yearly gains expanded to 8.2%. The yearly growth rate picked up a full 1.0 point over April's rate of 7.2% growth. As noted in past reports, these noteworthy gains on the yearly metric can't completely be attributed to current momentum; rather they are, in part, a result of the low price floor seen one year ago.
- Price trends remained mixed at the metro level, a reminder that price trends at the national and regional levels can tell a very different story. May's new metro recovery leader, Las Vegas, also highlights the importance of long-term perspective when analyzing quarterly and yearly trends in markets that were hard hit during the housing crisis.
- Las Vegas yearly gains ramped up to 27.0%, surpassing the yearly gains of 25.7% in Phoenix. This is the first time since April 2012 that Phoenix has not led the top 50 major metro markets in yearly gains. While Las Vegas yearly gains continue to pick up steam, the market has a long road ahead. Current prices remain 57.1% below the peak and would need to climb another staggering 133.3% to reach peak values. It would take Las Vegas home prices nearly four years at the current annual growth rate of 27.0% to get back to 2006 levels. While this is unrealistic over the short or even mid-term horizon, it puts the current gains into context.
- Phoenix on the other hand, has seen a slight moderating pattern over the last several months, a healthy move for a market that has been very hot over the last year. This market also has a long road ahead, with prices still 45.9% below their peak.
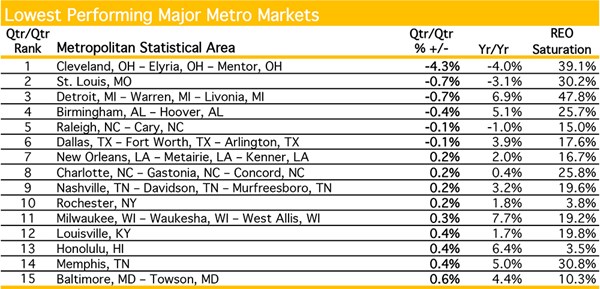
- Further evidence of spring's slightly positive impact: Severity of quarterly declines in the lowest performing markets subsided slightly in May, where only six out of 15 of the lowest performing markets saw declines and five of those saw less than 1.0% in losses.
- Cleveland was the exception, where quarterly losses of 4.3% fueled yearly declines of 4.0%. This market's low price point of less than $75 PPSF and high REO saturation rate of 39.1% continue to drive volatile trends.
- Contact Alanna Harter for your May 2013 file of the Top 30 MSAs or access our data on the Bloomberg Professional service by typing CLCA <GO>.
"May home price trends confirm the recovery continues to mature," said Dr. Alex Villacorta, vice president of research and analytics at Clear Capital®. "While there's no questioning the validity of the recovery at this point, performances at the local level remained mixed when considering strength, sustainability and relative positions to 2006 prices. For example, Las Vegas' strong yearly gains represent a rebound from a severe correction rather than bubble-like price growth. Despite 27.0% yearly growth, this market remains 53.0% below peak levels, significantly more depressed than most markets. Even if Las Vegas could parlay 27.0% annual growth, a highly unlikely outcome, it would take nearly four years for home prices to climb back up to high-rolling 2006 levels. On the other hand, some markets like Cleveland have yet to find a foothold in the recovery. Both Las Vegas and Cleveland are great reminders that granularity in home price trends remains key.
In general, national price trends are at a relatively healthy point and the diversity in price performance at the local level is mainly a function of the severity to which a particular housing market was hit during the housing crash. In general, we expect current gains to moderate over the near term. Certainly the expectation for moderation is less flashy than home prices racing their way back to pre-crisis levels. Yet moderation provides a sense of stability that is essential for both consumers and lenders, as it allows for both parties to calibrate to the current housing landscape."
For the complete file of the Top 30 MSA price trends for May 2013, please contact Alanna Harter.
Tables of Highest Performing and Lowest Performing Major Metro Markets are available at http://www.globenewswire.com/newsroom/prs/?pkgid=19098 and http://www.globenewswire.com/newsroom/prs/?pkgid=19099.