TRUCKEE, Calif., Aug. 6, 2013 (GLOBE NEWSWIRE) -- Clear Capital® (www.ClearCapital.com), the premium provider of data and solutions for real estate asset valuation and collateral risk assessment, today released its Home Data Index™ (HDI) Market Report with data through July 2013. Using a broad array of public and proprietary data sources, the HDI Market Report publishes the most granular home data and analysis earlier than nearly any other index provider in the industry.
July 2013 highlights include:
-- July home price trends continued to be strong for the nation and four regions.
- National home prices gained 9.3% over the last year and 1.6% over the last quarter. National home prices remain 33.4% below peak values, representing the New Normal.
- Regional yearly gains were led by the West's 17.8%, while the Northeast trailed with 4.8% growth. The Midwest and the South continued to closely track, with yearly gains of 7.5% and 7.6%, respectively. See our national map for July home price trends.
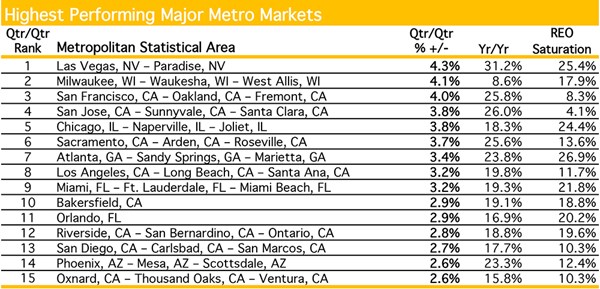
-- The top 15 performing metro markets, exhibited impressive yearly gains, with average growth of more than 20.0%. 14 metros posted yearly gains above 15.0%. See our chart of July's top 15 performing markets.
- Las Vegas yearly gains grew to 31.2%, the first metro to surpass 30.0% since the start of the recovery. Quarterly gains of 4.3%, the strongest of all the metros, signal this metro could retain its number one spot over the near-term.
- Perspective is key here. While Las Vegas leads the recovery, its median price of $145,000 ranks it below 35 of the top 50 markets. This suggests low price points are in part driving Las Vegas' gains. Conversely, San Jose has seen gains of 26.0% over the year, despite its high median price of $710,000, an indication that demand is fueled by a strong local economy. As such, these two markets will likely see a variance in their trends moving forward.
-- The lowest performing metros saw only two out of 15 post quarterly losses, with prices declining less than 1.0% for each. Average yearly gains for the group rest at 3.0%, evidence that the more active spring and summer buying season have helped buoy most major markets' home prices. See our chart of July's bottom 15 performing markets.
- Detroit home prices have risen 9.6% over the last year and while the metro remains on the lowest performing list, its quarterly gains of 1.0% are the highest for the group. These gains are particularly impressive against the backdrop of an REO saturation rate of 42.0%, more than 27.0 percentage points higher than the national average.
-- Contact Alanna Harter for your July 2013 file of the Top 30 MSAs or access our data on the Bloomberg Professional service by typing CLCA <GO>.
"While July home prices continue to ramp up throughout the country led by Las Vegas posting more than 30.0% yearly growth, let's not forget a healthy recovery means moderation as the new normal takes hold," said Dr. Alex Villacorta, vice president of research and analytics at Clear Capital. "Over the last half of 2013, we continue to call for a moderation in home price trends. A rising price floor will dampen some potential homebuyers' appetites, particularly as recent gains bring many markets back into pre-bubble equilibrium. In other words, homebuyers are starting to adjust to the new normal, where steep discounts from the peak are not as attractive as they once were. Having said that, if housing inventory continues rising, it should help alleviate some of the recent pressure on prices, as well as homebuyers' confidence in the market's health overall.
"After these shifting fundamental drivers shake out, we expect the recovery to continue at a healthier and more sustainable pace. Certainly Las Vegas is the strongest example of a market that is really hot, with yearly growth of 31.2%. While these gains are a nice pick-up off the price floor, they will not last over the long term. We expect most of the major markets across the country to follow the path of sharp upward corrections in the short term, followed by moderating gains as markets fall back in line with their long run levels. Phoenix, for example, is now seeing quarterly growth that supports a yearly growth rate more in line with 10.0%, as opposed to the current yearly gains of 23.3%. The exact timing of this moderation will vary market by market. In Detroit, for example, given the current uncertainty in the municipal finances, it will likely be some time before REO saturation subsides to a level more in line with national rates and prices bounce back in a meaningful way. While Detroit has struggled with high levels of distressed activity since the housing market collapse, the recent financial developments for the metro will likely serve as another hurdle. Big picture, though, the housing market overall is in a great position and likely to continue to improve. All the more reason we must continue to observe performance market by market. What holds true for Las Vegas doesn't hold true for Detroit, let alone San Jose."
For the complete file of the Top 30 MSA price trends for July 2013, please contact Alanna Harter.
Graphics accompanying this news release are available at
http://www.globenewswire.com/newsroom/prs/?pkgid=20228