Ottawa, Feb. 10, 2026 (GLOBE NEWSWIRE) -- Global electricity consumption from data centers is projected to surge significantly, driven by the rise of cloud computing and AI. The chart shows the various components of data center energy use, including servers, IT equipment, cooling, and infrastructure. The growth trend is steep, particularly between 2021 and the projected 2025 estimate, with cooling and infrastructure taking up a larger share of the total energy footprint, according to data published by Precedence Research.
Invest in Our Premium Strategic Solution: https://www.precedenceresearch.com/request-consultation/18
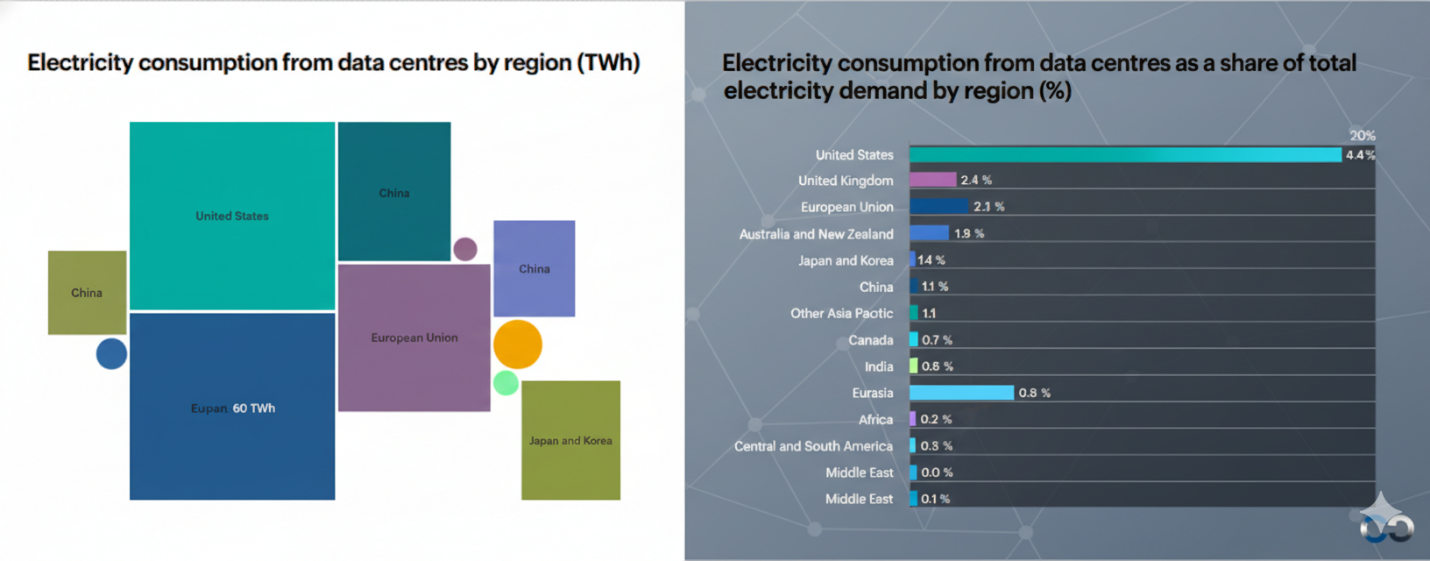
Total Energy Consumption (TWh)
The left half uses a treemap chart, which uses various sized squares and rectangles to represent the volume of electricity used, measured in Terawatt-hours (TWh).
- Dominant Players: The United States and China occupy the largest blocks, indicating they are the heaviest consumers of electricity for data centers globally.
- Regional Groupings: The European Union also holds a significant portion of the chart.
- Visual Representation: The different colors (teals, blues, and purples) help distinguish between the regions. Smaller circles and squares scattered on the right side of this section represent regions with lower total consumption, such as Japan and Korea.
Request Research Report Built Around Your Goals: sales@precedenceresearch.com
Share of Total Electricity Demand (%)
The right half shifts the focus from "how much is used" to "how much of a region’s total power goes to data centers." It uses a horizontal bar graph set against a background featuring a subtle network-link pattern.
- The United States Lead: The U.S. stands out significantly at the top. While its total usage is high, the data center industry also accounts for a much larger "slice" of its overall national electricity pie—labeled here at 4.4% (with a secondary projection or peak marker at 20%).
- Comparative Scale:
- United Kingdom & EU: These follow the U.S., with data centers making up roughly 2.4% and 2.1% of their total electricity demand, respectively.
- Developing Markets: Regions like India, Africa, and the Middle East show much shorter bars (often under 1%), suggesting that data centers currently play a much smaller role in their overall energy grids.
- Design Elements: The bars are color-coded to match the regions on the left, creating a cohesive look. The numbers are clearly labeled at the end of each bar for quick reading.
Global Electricity Consumption
This chart illustrates the total energy used by data centers worldwide, measured in Terawatt-hours (TWh).
- Growth Trend: Consumption has grown steadily from 2005 to 2021, with a massive projected spike leading into 2025. In 2008, the total was 153.5 TWh, but it is expected to approach 500 TWh by 2025.
- The Components:
- Servers: The largest single energy user, represented by the light blue base layer.
- Other IT equipment: Networking and storage, shown in dark blue.
- Cooling: Essential for preventing hardware failure, shown in light green.
- Other infrastructure: Power backups and facility lights, shown in teal.
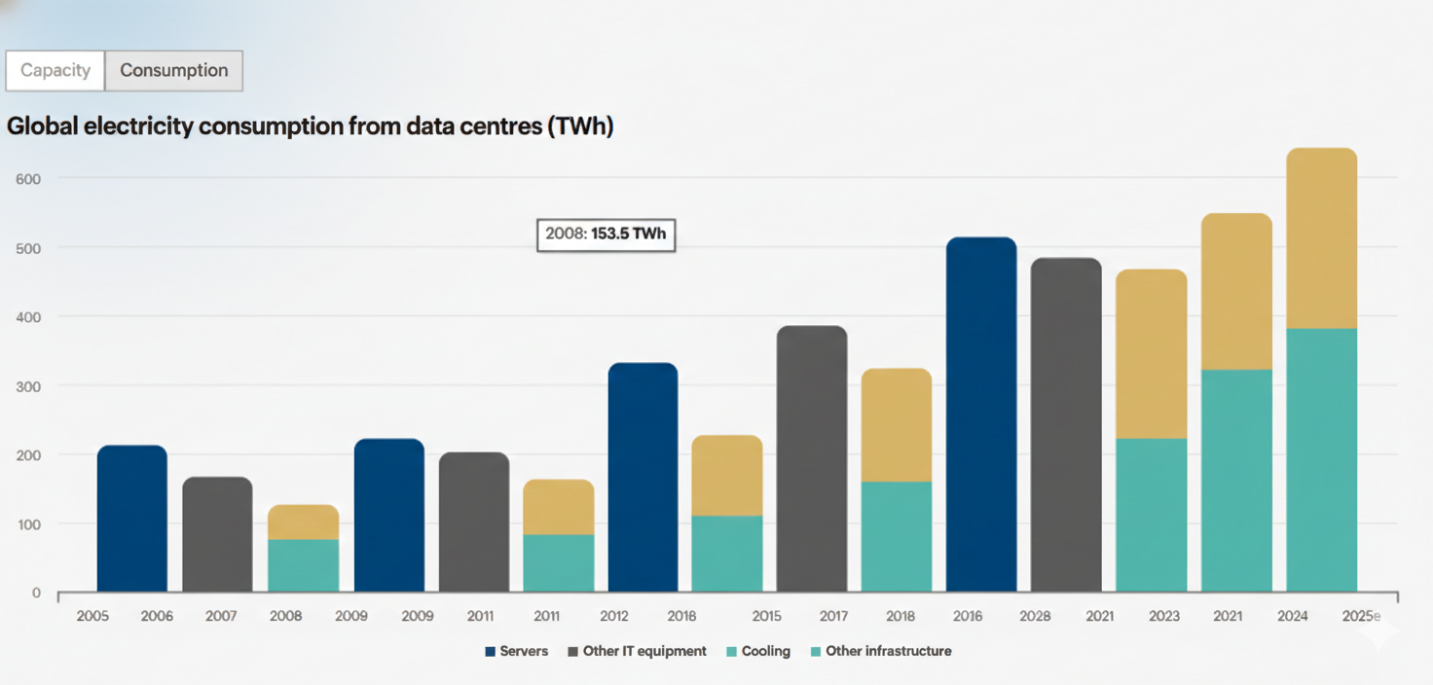
Global electricity consumption from data centers, measured in Terawatt-hours (TWh), spanning from 2005 to an estimated projection for 2025.
It breaks down the energy usage into four key categories, represented by different colors:
- Servers: The core computing power.
- Other IT equipment: Storage and networking hardware.
- Cooling: Systems used to keep the hardware from overheating.
- Other infrastructure: Lighting, power distribution, and general facility needs.
Key Trends and Observations
- Overall Growth: There is a clear, aggressive upward trend in energy demand. While consumption hovered between 150 and 250 TWh in the late 2000s, it is projected to spike significantly, surpassing 600 TWh by 2025.
- Changing Composition: In the earlier years (like 2005–2012), the bars are often solid, focusing heavily on the IT equipment itself. As we move into the 2020s, the bars become "stacked." This highlights that while the servers are doing the work, the energy required for Cooling (teal) and Infrastructure (gold) is taking up a much larger share of the total footprint.
- The 2008 Benchmark: The chart specifically highlights the year 2008, noting a consumption of 153.5 TWh. This serves as a baseline to show that in less than 20 years, the energy requirements of the digital world have roughly quadrupled.
- Recent Acceleration: The jump between 2021 and the 2025 estimate is particularly steep. This suggests that the expansion of cloud computing, AI, and massive data storage needs is outpacing historical growth rates.
Invest in Our Premium Strategic Solution: https://www.precedenceresearch.com/request-consultation/18
Request Research Report Built Around Your Goals: sales@precedenceresearch.com
Contact Us:
Email: sales@precedenceresearch.com
USA: +1 8044 419344 | APAC: +61 4859 81310 / +91 87933 22019 | Europe: +44 7383 092 044
Precedence Research – Turning Data Noise Into Strategic Clarity.
